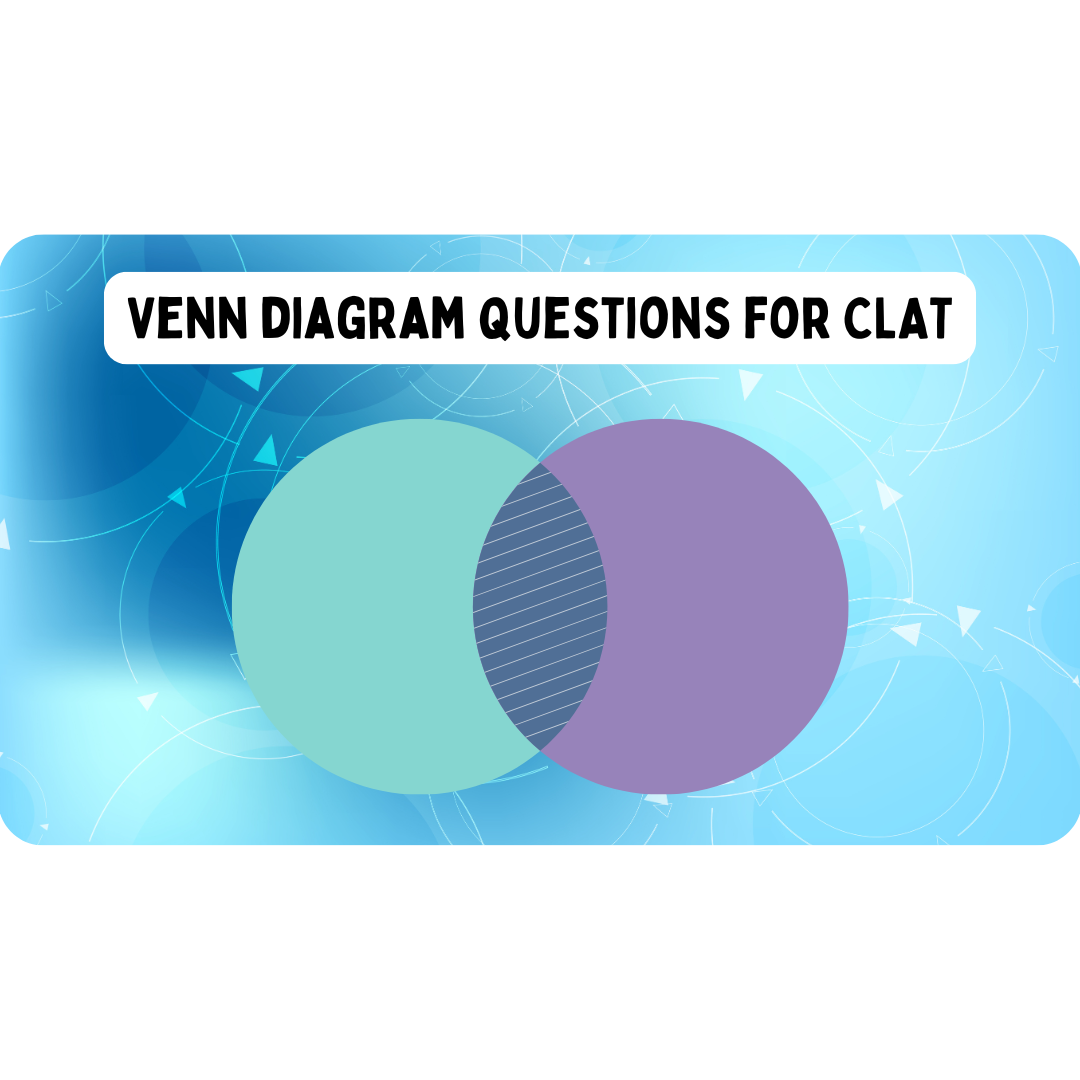
Venn diagram questions for CLAT are an essential component of the logical reasoning section and often determine how well a candidate can interpret and analyze relationships between different sets or categories. A typical Venn diagram question requires you to visualize data using overlapping circles, which helps in identifying commonalities and differences among groups.
These questions test critical thinking and the ability to draw logical conclusions from given information. Mastering Venn diagram questions for CLAT not only boosts your score in logical reasoning but also improves your overall analytical skills—something that’s crucial for success in law entrance exams.
To gain confidence in solving a Venn diagram question, it’s important to engage in consistent practice. Work through a variety of question formats, including set-based, classification, and syllogism-type problems. Solve CLAT-specific mock tests, review previous years’ question papers, and attempt topic-wise quizzes to get accustomed to the exam pattern.
Additionally, learning how to quickly sketch rough diagrams and eliminate incorrect options can enhance both speed and accuracy. Focus on understanding basic set theory concepts and logical structures, as these form the foundation for tackling any Venn diagram questions for CLAT.
With regular practice and the right strategy, you can easily turn Venn diagram questions into one of your strengths in the CLAT logical reasoning section.
Importance of Logical Reasoning in CLAT

The logical reasoning section in CLAT tests your ability to evaluate arguments, identify patterns, and draw conclusions—skills vital for law school and a legal career.
A key part of this section includes Venn diagram questions for CLAT, which assess your understanding of relationships between sets using set theory. Mastering these improves accuracy and boosts your overall score.
Regular practice with different logical reasoning CLAT questions—like assumptions, conclusions, and Venn diagrams—is essential. Use mock tests and past papers to build speed and confidence.
| Subject | Questions | Weightage |
| English Language | 22–26 | 20% |
| Current Affairs & GK | 28–32 | 25% |
| Legal Reasoning | 28–32 | 25% |
| Logical Reasoning | 22–26 | 20% |
| Quantitative Techniques | 10–14 | 10% |
Strong performance in logical reasoning CLAT can give you a significant edge in the exam and beyond.
Venn Diagram Questions in CLAT
Following are the 25 Venn Diagram Questions for CLAT:
Venn Diagram Question Passage 1
In an exam featuring three subjects—Mathematics, Physics, and Chemistry—certain students failed in individual subjects. Specifically, 40 students failed only in Mathematics, 50 failed only in Chemistry, and 60 failed only in Physics. A total of 200 students successfully passed all three subjects.
Additionally, 400 students cleared Mathematics, 550 cleared Physics, and 500 passed Chemistry. The number of students who failed in all three subjects is equal to 25% of those who passed Mathematics.
Questions:
Q1. What is the total number of students who failed in at least one subject?
(a) 800
(b) 700
(c) 600
(d) 550
Q2. The number of students who failed in all three subjects is what percentage of those who passed all subjects?
(a) 40%
(b) 50%
(c) 30%
(d) 20%
Q3. What is the ratio of students who failed in Physics to those who failed in Chemistry?
(a) 1 : 2
(b) 2 : 1
(c) 1 : 1
(d) 9 : 10
Q4. How many students passed in exactly one subject?
(a) 460
(b) 290
(c) 350
(d) 550
Q5. What is the total number of students who appeared for the examination?
(a) 900
(b) 800
(c) 1000
(d) 1200
Venn Diagram Question Passage 2
Out of a class of 200 students, everyone appeared in an exam that included three subjects—P1, P2, and P3. The pass percentage for each paper was as follows: 56% in P1, 63% in P2, and 56.5% in P3. Among the students, 11% passed only in P1 and P2, 8% passed only in P1 and P3, and 22% cleared all three papers. Not a single student failed in all three subjects.
- How many students passed in P2 and P3 but failed in P1?
(a) 22
(b) 24
(c) 25
(d) 28 - What is the ratio of students who passed only P2 to those who passed only P3?
(a) 3 : 2
(b) 4 : 3
(c) 5 : 4
(d) 6 : 5 - Students who passed only P1 form what percentage of those who passed P1 and P3 but not P2?
(a) 187.5%
(b) 157.5%
(c) 112.5%
(d) 97.5% - What percentage of students passed in at most one of the three subjects?
(a) 43.5%
(b) 44.5%
(c) 45.5%
(d) 46.5% - What is the difference between the total number of students who passed P3 and those who passed only P3?
(a) 81
(b) 83
(c) 85
(d) 87
Venn Diagram Question Passage 3
In a group of x sportsmen, some participated in three major events: Olympics, Asian Games, and Commonwealth Games (CWG). Here’s how participation breaks down:
- 50% of them took part in the Olympics
- 53% participated in the Asian Games
- 42% joined the CWG
- 10% participated in both Olympics and Asian, but not in CWG
- 14% took part in Olympics and CWG, but not in Asian
- 5% participated in Asian and CWG, but not in Olympics
Use the information to answer the following:
- If the total number of sportsmen (x) is 300, how many participated in all three events?
(a) 20
(b) 24
(c) 30
(d) 36 - If 81 sportsmen participated only in the Olympics, what is the total number of participants?
(a) 360
(b) 420
(c) 450
(d) 480 - If 48 sportsmen took part in all three events, how many in total participated in the Asian Games?
(a) 272
(b) 296
(c) 310
(d) 318 - If exactly 58 sportsmen took part in any two events only, how many joined all three competitions?
(a) 16
(b) 20
(c) 24
(d) 12 - If the total number of sportsmen is 300, what is the ratio between those who participated only in the Olympics and those who took part only in CWG?
(a) 3 : 2
(b) 4 : 3
(c) 5 : 4
(d) 6 : 5
Venn Diagram Question Passage 4
In a class test attended by 250 students, the subject-wise passing details are as follows:
- 16% passed only Physics, with the boys-to-girls ratio (B:G) being 3:2.
- 24% passed only Chemistry, with a B:G ratio of 7:5.
- 30% passed only Maths, where B:G = 7:8.
- 8% cleared Physics and Chemistry but not Maths, with a B:G of 2:3.
- 6% passed all three subjects, and the B:G ratio is 2:3.
- 9.6% passed Physics and Maths but failed in Chemistry, with a B:G of 3:1.
No student failed in all three subjects. Also, the difference between the number of boys and girls in the entire class is 14.
- What is the ratio of boys to girls who passed Chemistry and Maths but failed in Physics?
(a) 3:5
(b) 4:5
(c) 4:7
(d) 5:7 - How many girls passed in exactly one subject?
(a) 72
(b) 75
(c) 78
(d) 81 - What is the total number of boys who passed in exactly two subjects?
(a) 28
(b) 32
(c) 36
(d) 40 - The number of girls who passed Physics and Chemistry but failed in Maths is what percentage of those who passed Chemistry and Maths but not Physics?
(a) 75%
(b) 80%
(c) 120%
(d) 150% - The number of boys who passed only Chemistry is what percentage of girls who passed only Maths or only Physics?
(a) 72.5%
(b) 65%
(c) 62.5%
(d) 60%
Venn Diagram Question Passage 5
In a company with 500 employees, the staff hold bank accounts as follows:
- 53.6% have an account with SBI
- 44% with ICICI
- 34% with HDFC
Further segmentation:
- 5% of the total have accounts in both SBI and HDFC, but not in ICICI
- 9% (180% of 5%) hold accounts in SBI and ICICI, but not in HDFC
- 3.6% have accounts in all three banks
- 10.4% have accounts in ICICI and HDFC, but not in SBI
- How many employees have an account only in ICICI Bank?
(a) 75
(b) 105
(c) 180
(d) 220 - What percentage of employees have an account only in HDFC?
(a) 9%
(b) 12%
(c) 15%
(d) 24% - How many employees have an account in exactly one bank?
(a) 270
(b) 320
(c) 350
(d) 360 - The number of employees who have an account in all three banks is what percentage of those with an account only in SBI?
(a) 6%
(b) 8%
(c) 10%
(d) 12% - Approximately, what percentage of employees have accounts in at least two banks compared to those who have accounts in almost two banks?
(a) 24%
(b) 29%
(c) 34%
(d) 39%
Tips for Solving Venn Diagram Questions in CLAT:
- Solve Venn diagram questions consistently to get familiar with various formats like set-based, classification, and syllogism problems.
- Attempt CLAT mock tests, review past year papers, and take topic-wise quizzes to understand the exam pattern.
- Focus on understanding basic set theory concepts such as union, intersection, and complement.
- This will enhance your ability to solve Venn diagram problems quickly and accurately.
- Draw rough Venn diagrams swiftly to visualize relationships between sets.
- This helps in understanding the data better, especially when time is limited during the exam.
- In multiple-choice questions, first eliminate obviously incorrect answers.
- This reduces the number of choices and increases your chances of selecting the correct answer.
Conclusion
Mastering Venn diagram questions for CLAT is an important step toward improving your logical reasoning score and overall CLAT preparation. With consistent practice, a clear understanding of set theory, and the right strategies, you can confidently tackle these questions and increase your chances of success.
To Download Monthly Current Affairs PDF Click here
Click here to get a free demo
Discover all about CLAT Exam
